System Monitoring
Monitoring with top
The top command provides a real-time, text-based system monitoring dashboard, displaying resource usage like CPU, memory, swap, and running processes. you can run top with command like below:
top
Press q to exit.
Understanding top Output
When you run top, you will see an output like this:
top - 12:34:56 up 2 days,  3:21,  1 user,  load average: 0.45, 0.33, 0.20
Tasks: 195 total,   2 running, 193 sleeping,   0 stopped,   0 zombie
%Cpu(s):  1.3 us,  0.3 sy,  0.0 ni, 98.3 id,  0.1 wa,  0.0 hi,  0.0 si,  0.0 st
KiB Mem :  8000000 total,  2200000 free,  3600000 used,  2200000 buff/cache
KiB Swap:  4000000 total,  4000000 free,       0 used.  3000000 avail Mem
Breaking Down top Output
Uptime & Load: Displays system uptime and load averages (CPU workload for the last 1, 5, and 15 minutes).Tasks: Shows the number of running, sleeping, stopped, and zombie processes.CPU Usage: Includes user (%us), system (%sy), idle (%id), and waiting (%wa) CPU time.Memory Usage: Displays total, used, free, and cache memory.Swap Usage: Shows total, used, and available swap space.
top Commands
- Navigation
↑↓scroll,PgUp/PgDnpage scroll,←→move fields,Shift+Cshow index.
- Sorting
Shift+PCPU,Shift+Mmemory,Shift+Rreverse,f (then s)sort on any field.
- Searching/Filtering
Shift+Lsearch,oadd filter(USER=eric),Ctrl+Oview filters,=clear filters.
- Other
kkill process,dset refresh rate,Shift+Wsave settings,mtoggle memory view,Shift+E/echange memory scale.
Using btop
btop is an advanced and visually appealing system monitor that provides detailed CPU, memory, network, disk, and process statistics.
Installing and Running btop
Use btop
# Install btop
sudo apt install btop  # Debian/Ubuntu
sudo yum install btop  # RHEL/CentOS
sudo pacman -S btop    # Arch Linux

# Run btop
btop
To exit, press q or Esc.
Understanding btop Output
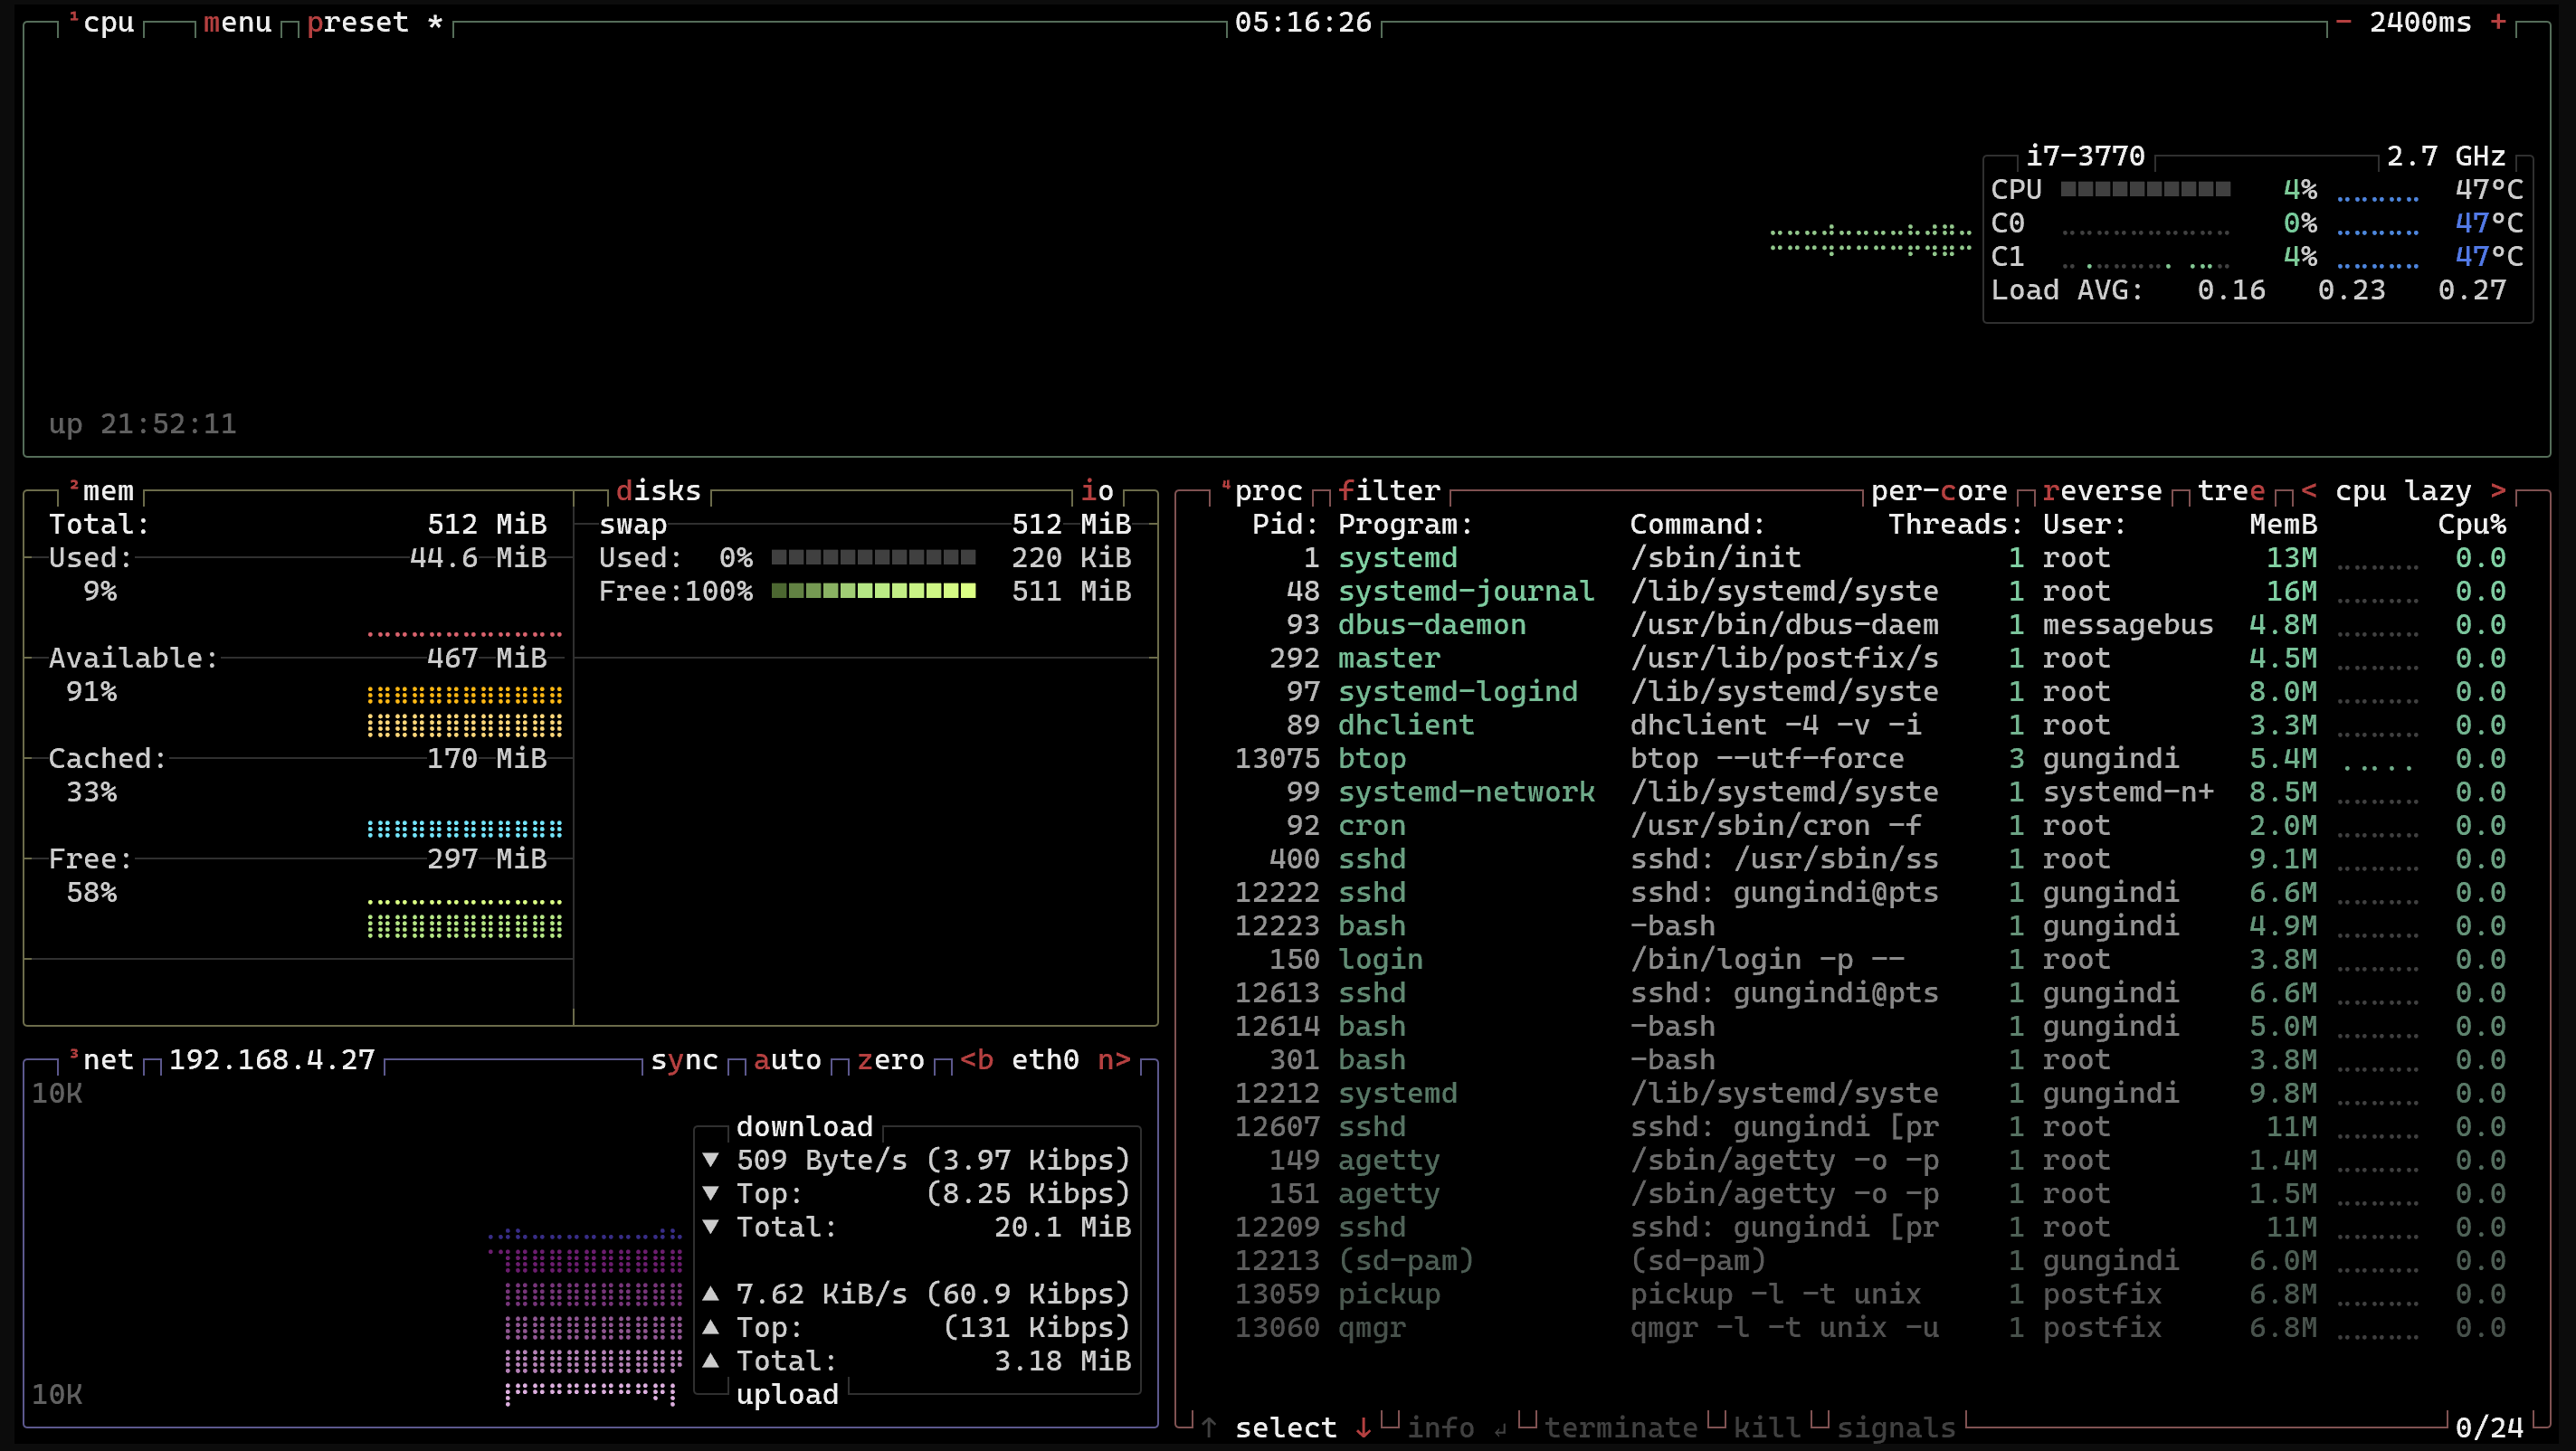
When you run btop, the interface consists of multiple sections:
CPU Usage: Displays real-time CPU usage per core, average load, and process priority usage. Includes temperature readings (if supported).Memory & Swap Usage: Graphically represents RAM and swap usage, showing cached, free, and used memory.Processes List: Displays process ID (PID), command, CPU/memory usage, and runtime. Supports sorting and filtering.Network Usage: Shows real-time upload/download speeds and total data transferred.Disk Activity: Displays read/write speeds and available/used disk space.
Important btop Commands
- Navigation
↑↓scroll processes,PgUp/PgDnpage scroll.
- Sorting
←→switch sorting (CPU/memory),/search for a process.
- Managing Processes
DEL/kkill,rchange priority,ppause/resume.
- View Options
Esctoggle views,Shift+Echange memory scale.
- Settings
Shift+Wsave preferences,F2open settings menu.